JMeter Reporting Options

Introduction
As a widely-used open-source load testing tool, Apache JMeter provides several reporting options that enable users to analyze and visualize the performance of their applications. From simple graphical representations to more advanced, interactive visualizations, JMeter's reporting options cater to the diverse needs of testers. In this blog post, we will explore the various reporting options available in JMeter, and guide you through selecting the most suitable reporting method for your requirements.
Basic Reporting Options
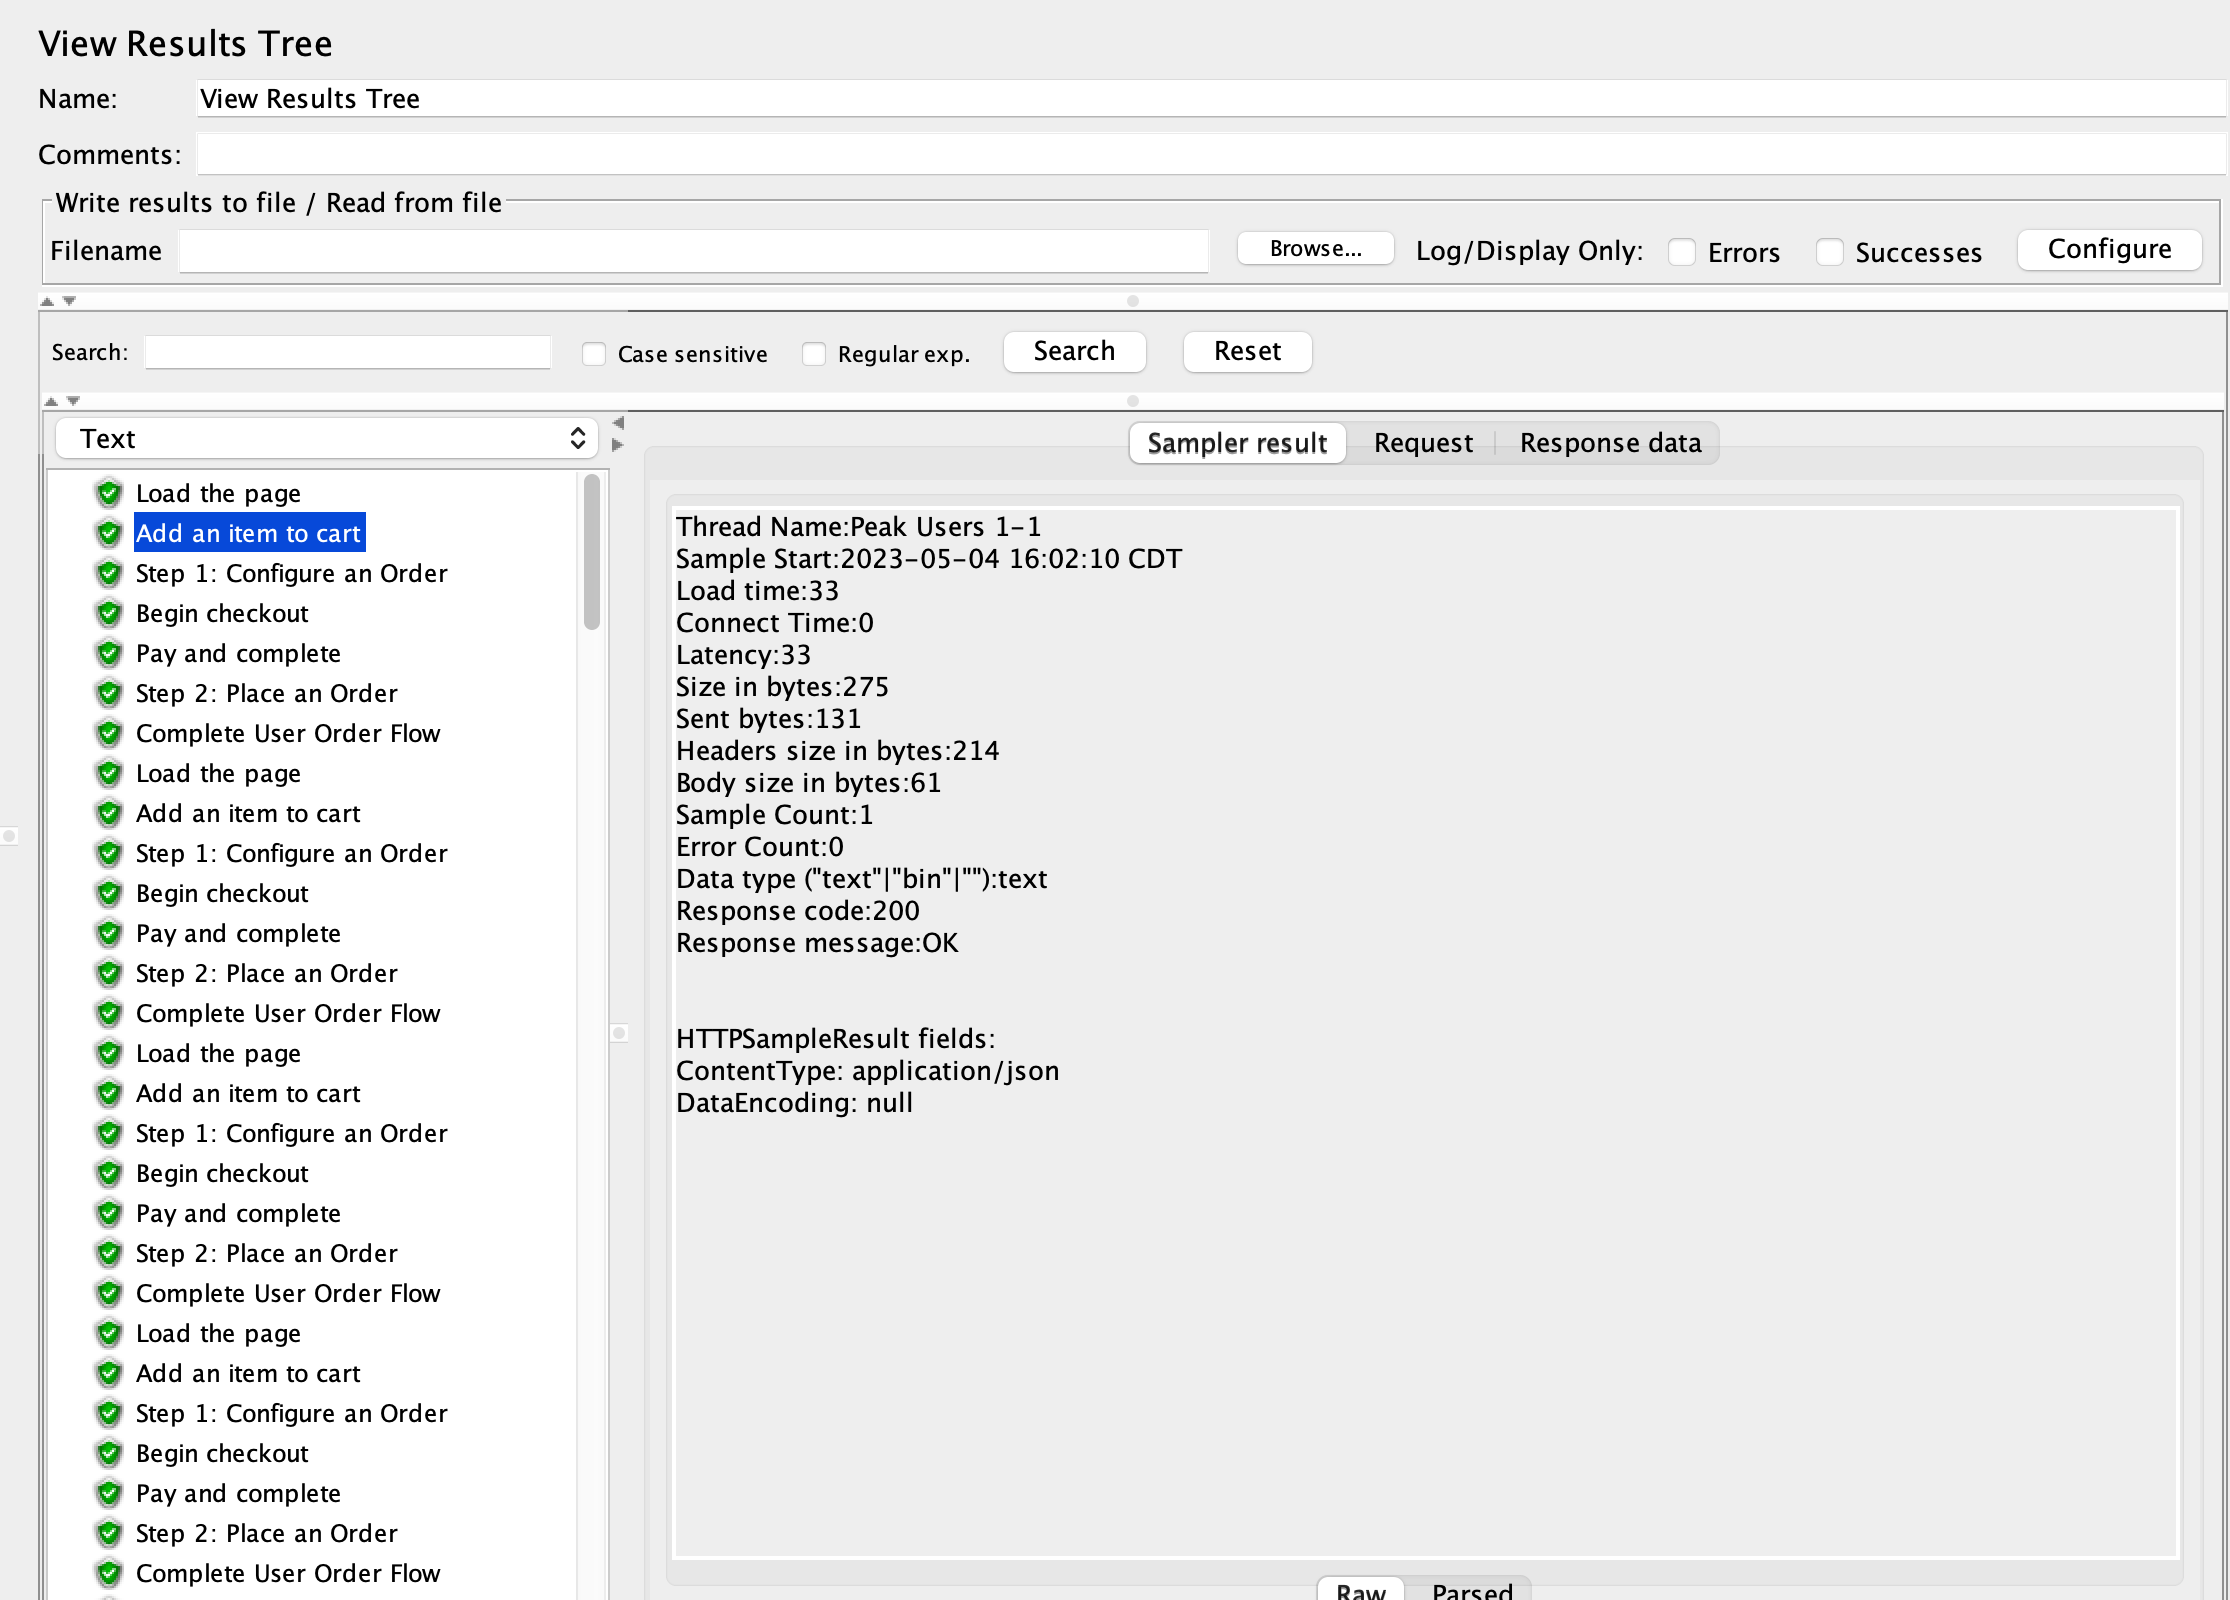
View Results Tree
The View Results Tree listener is the most basic reporting option in JMeter. It displays the results of each sampler request in a tree format, allowing users to view the request and response data in real-time. This can be useful for debugging issues during test execution, but it is not recommended for large-scale tests, as it can consume a lot of memory.
To add this element in your test plan, right click -> Add -> Listeners -> View Results Tree.
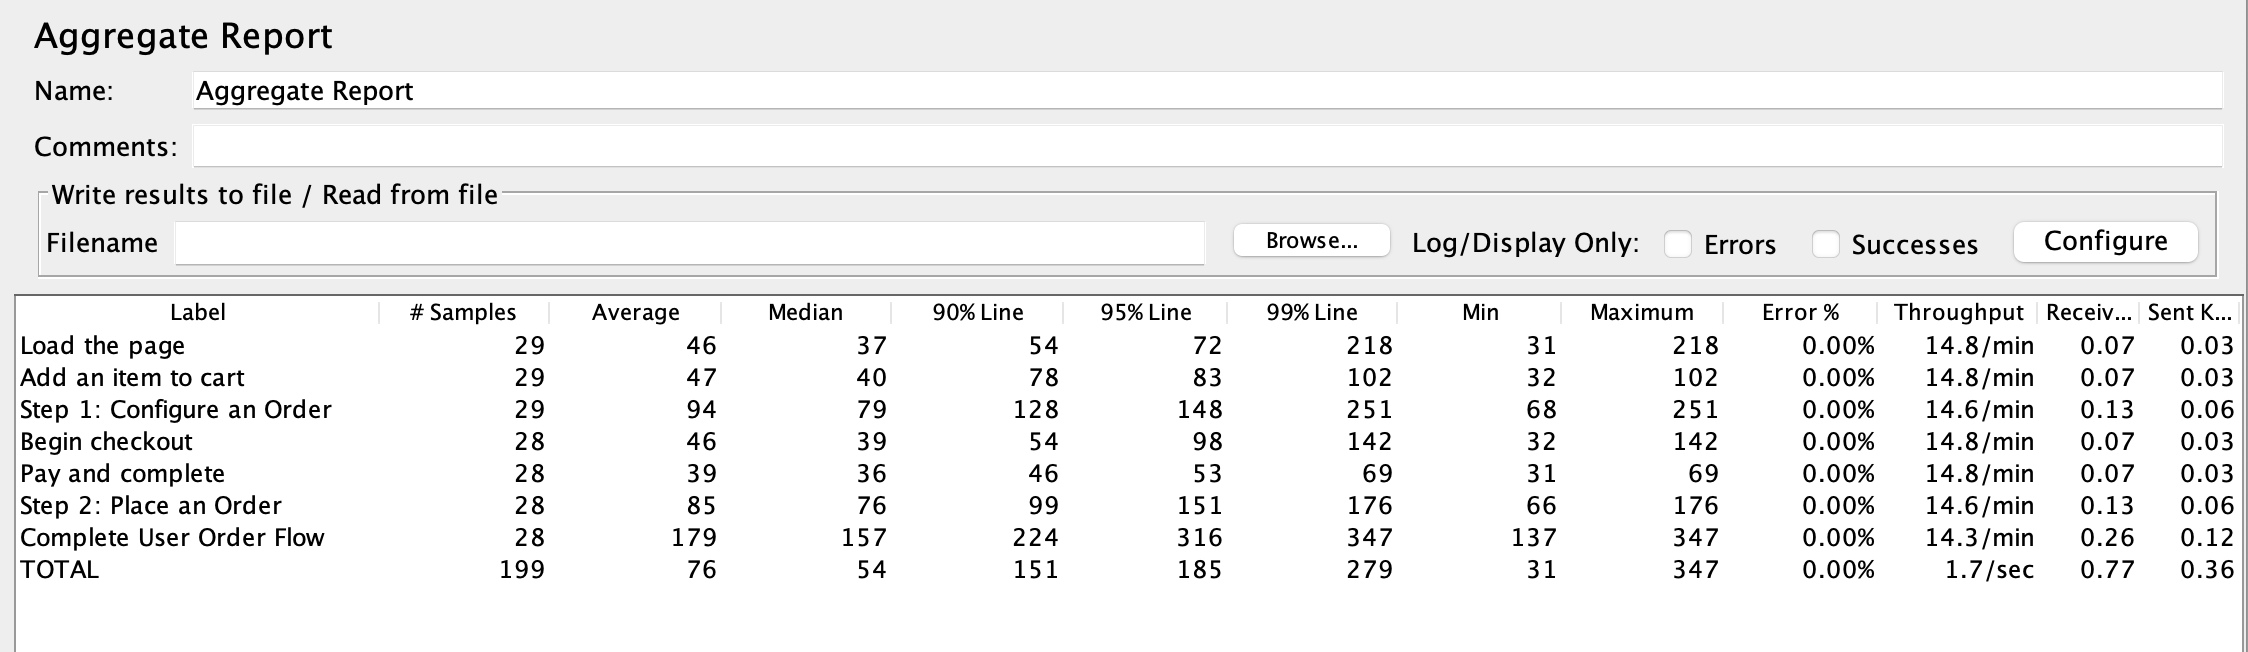
Aggregate Report
The Aggregate Report listener compiles the test results into a summary table, displaying key performance metrics such as average response time, min/max response times, error rates, and throughput. This is a simple yet effective way to analyze the performance of your web application and identify bottlenecks.
To add this element in your test plan, right click -> Add -> Listeners -> Aggregate Report.
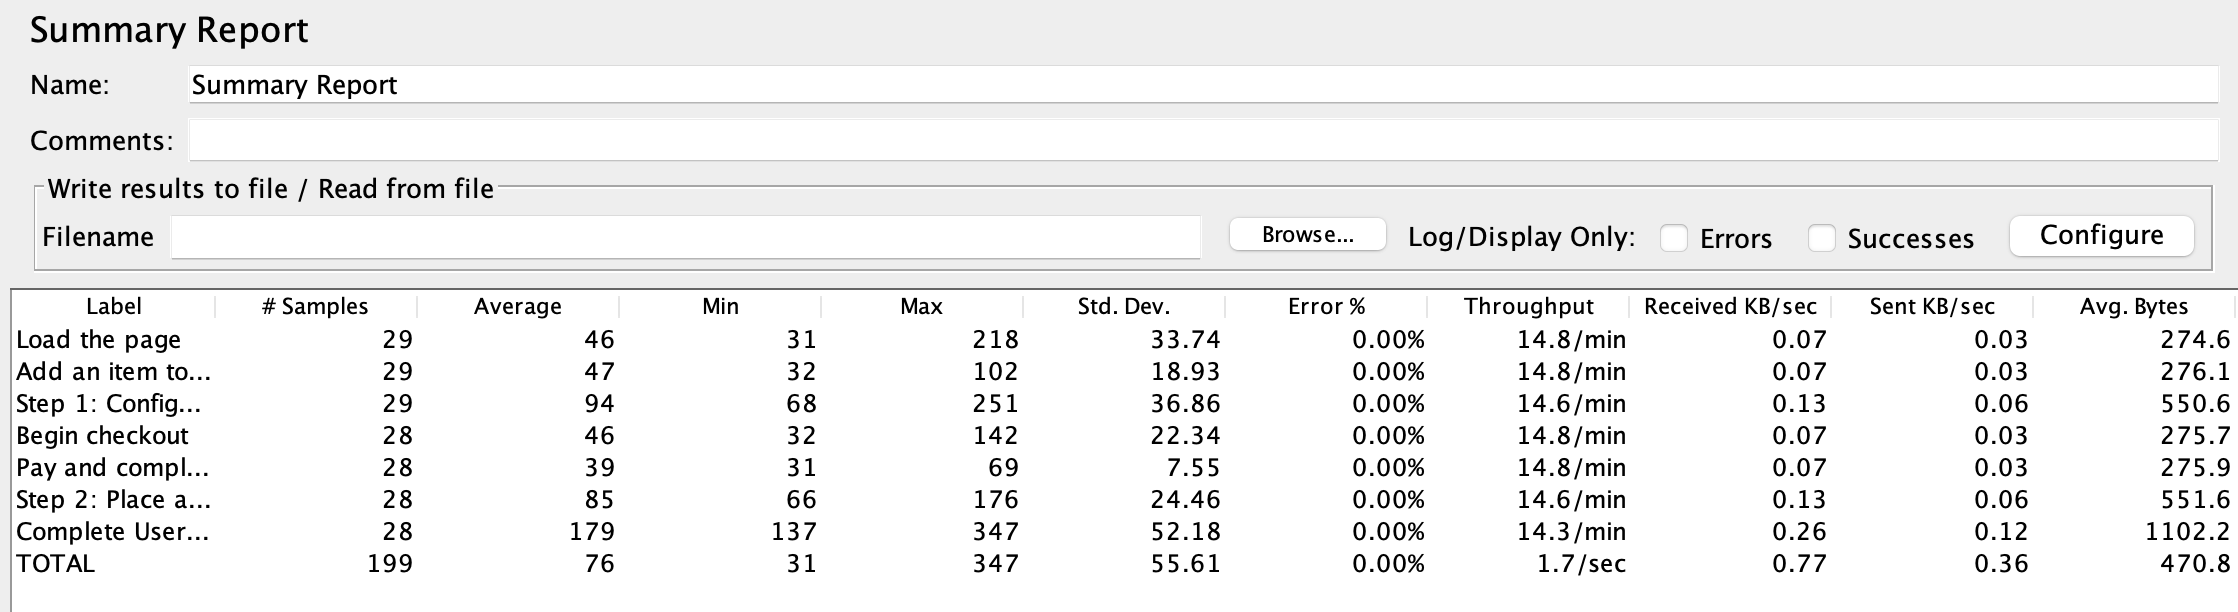
Summary Report
Similar to the Aggregate Report, the Summary Report provides a tabular summary of key performance metrics. However, it offers additional columns for standard deviation, median, and the 90th percentile, providing a more detailed insight into the test results.
To add this element in your test plan, right click -> Add -> Listeners -> Summary Report.
Simple Data Writer
The Simple Data Writer listener is a lightweight reporting option that saves the test results to a file in various formats, such as CSV, XML, or JSON. This can be helpful for users who want to analyze the results using external tools or create custom reports. The Simple Data Writer is resource-efficient and suitable for large-scale tests, as it does not consume much memory. But the output will be huge for a large test.
Advanced Reporting Options
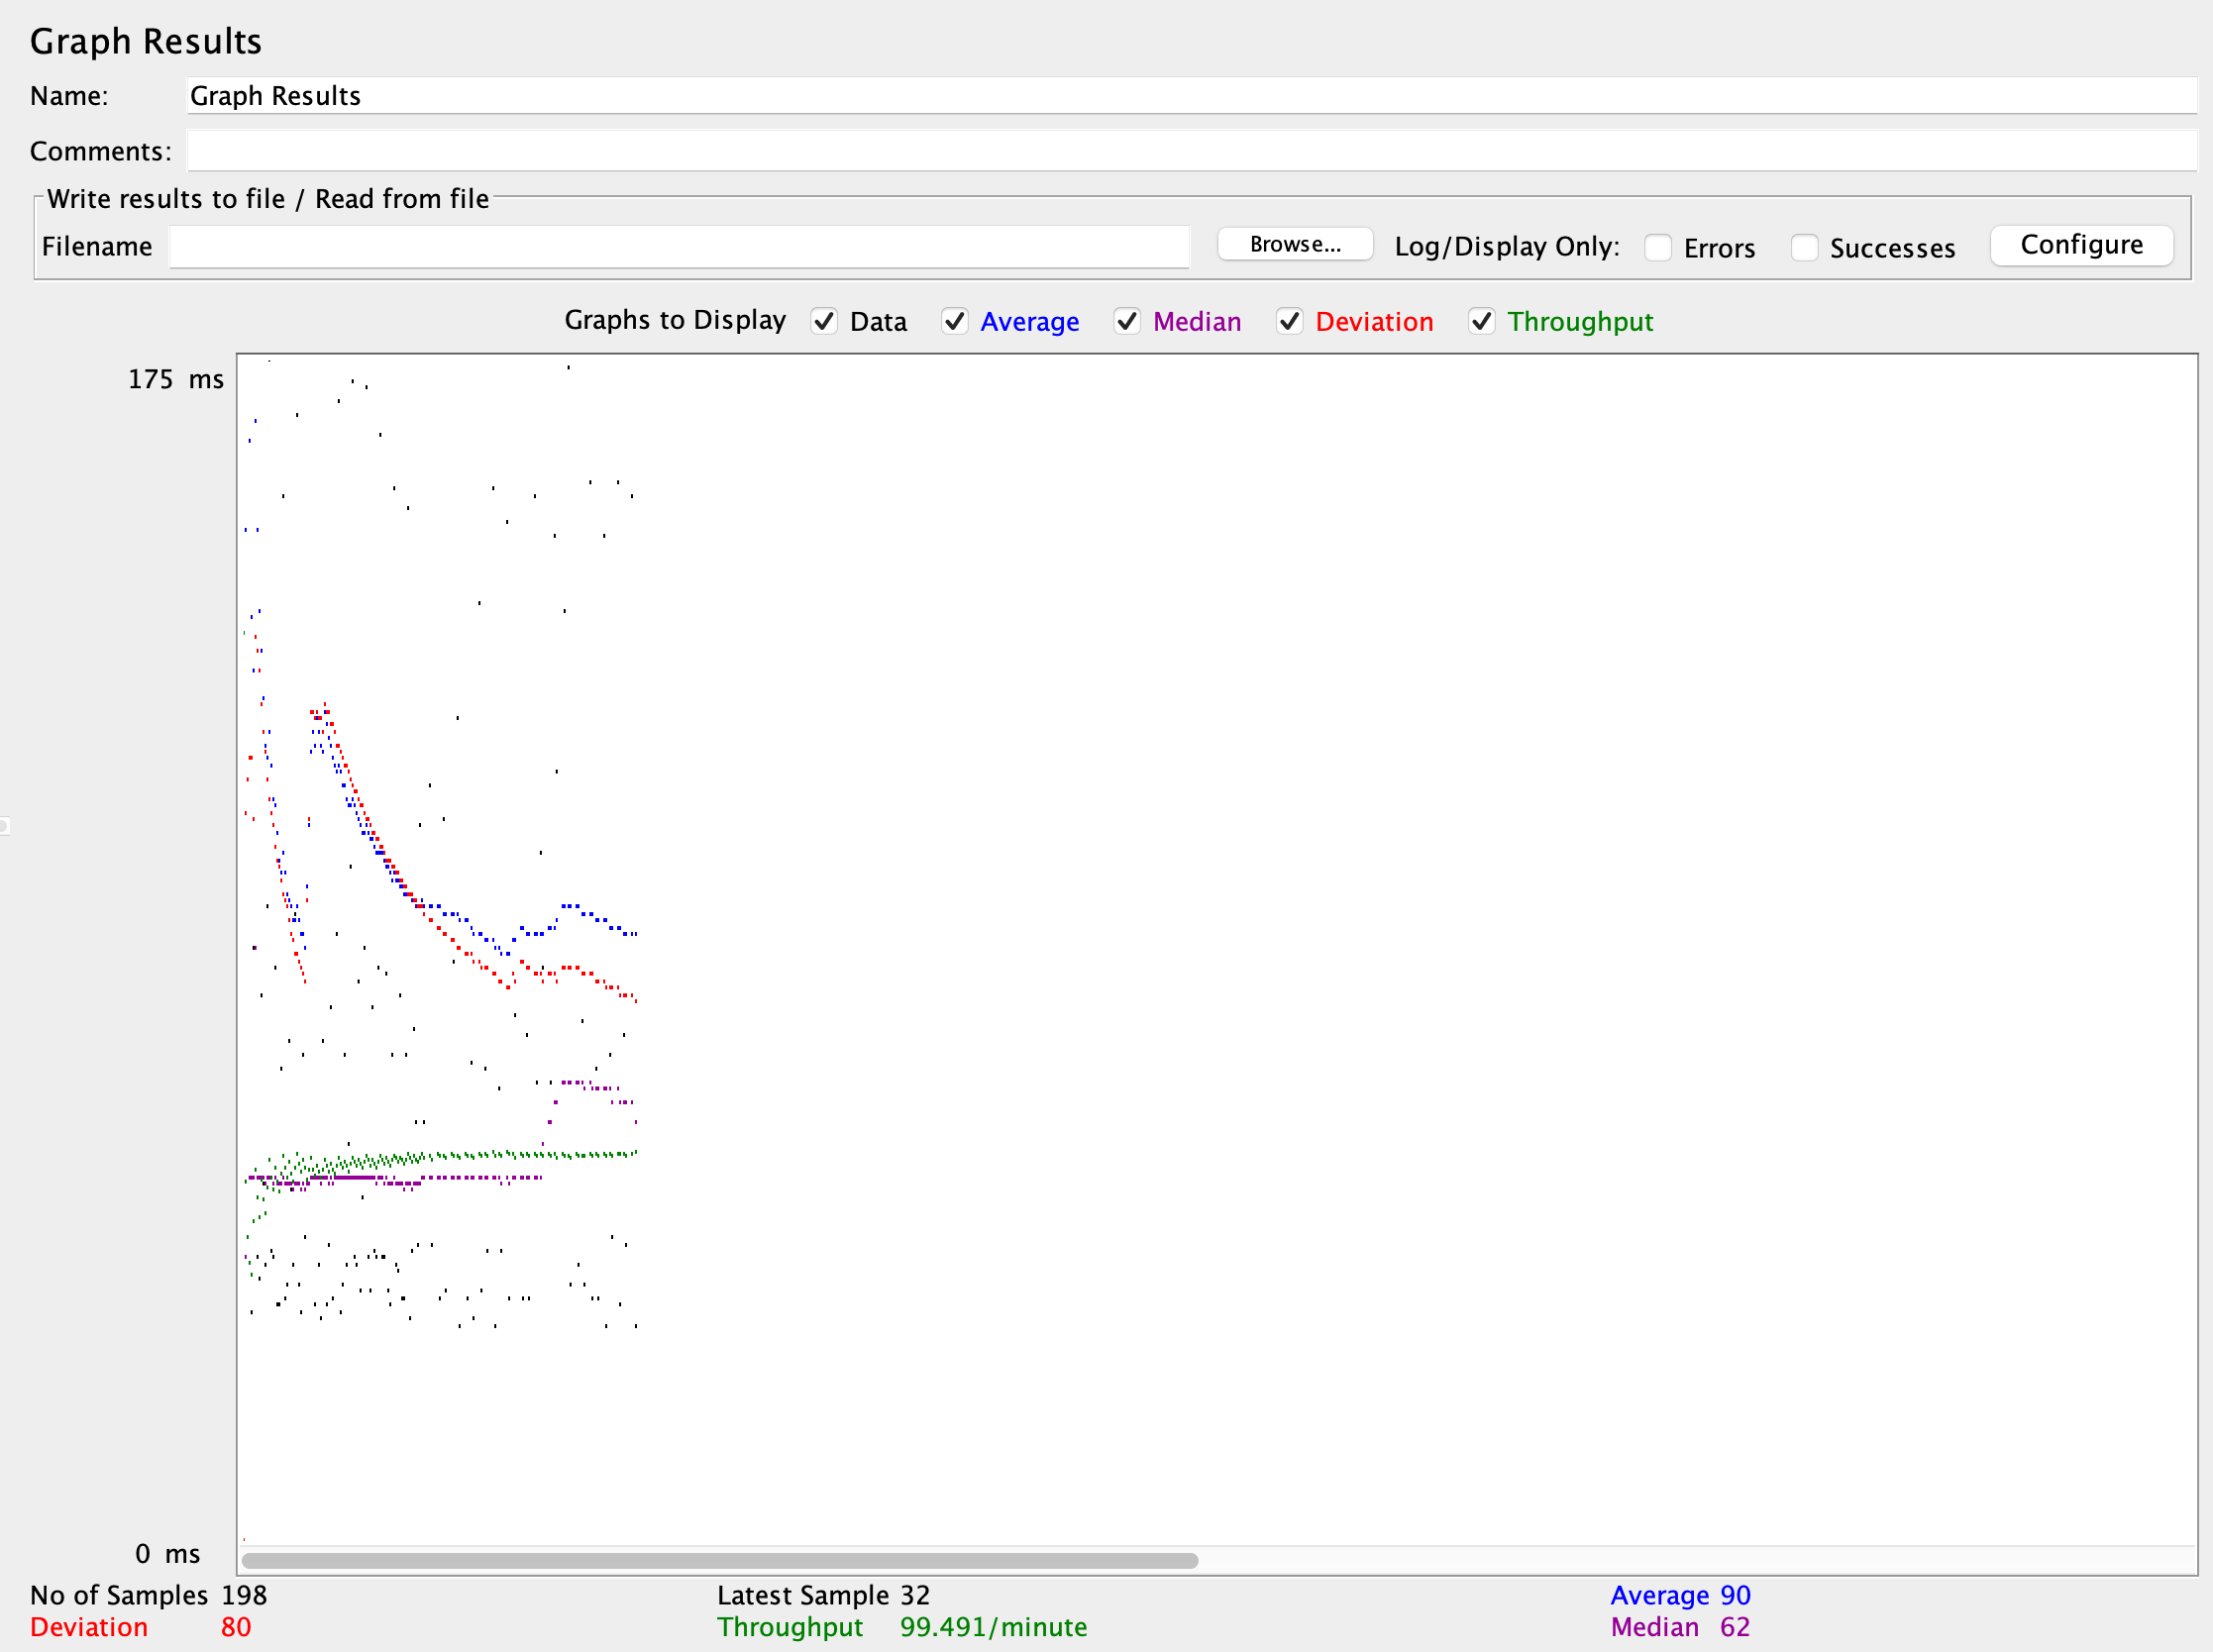
Graph Results
The Graph Results listener creates a real-time graph of the test results, plotting response times, throughput, and errors over time. This visualization can help users identify trends and patterns, and it can be exported as a PNG image for further analysis or sharing.
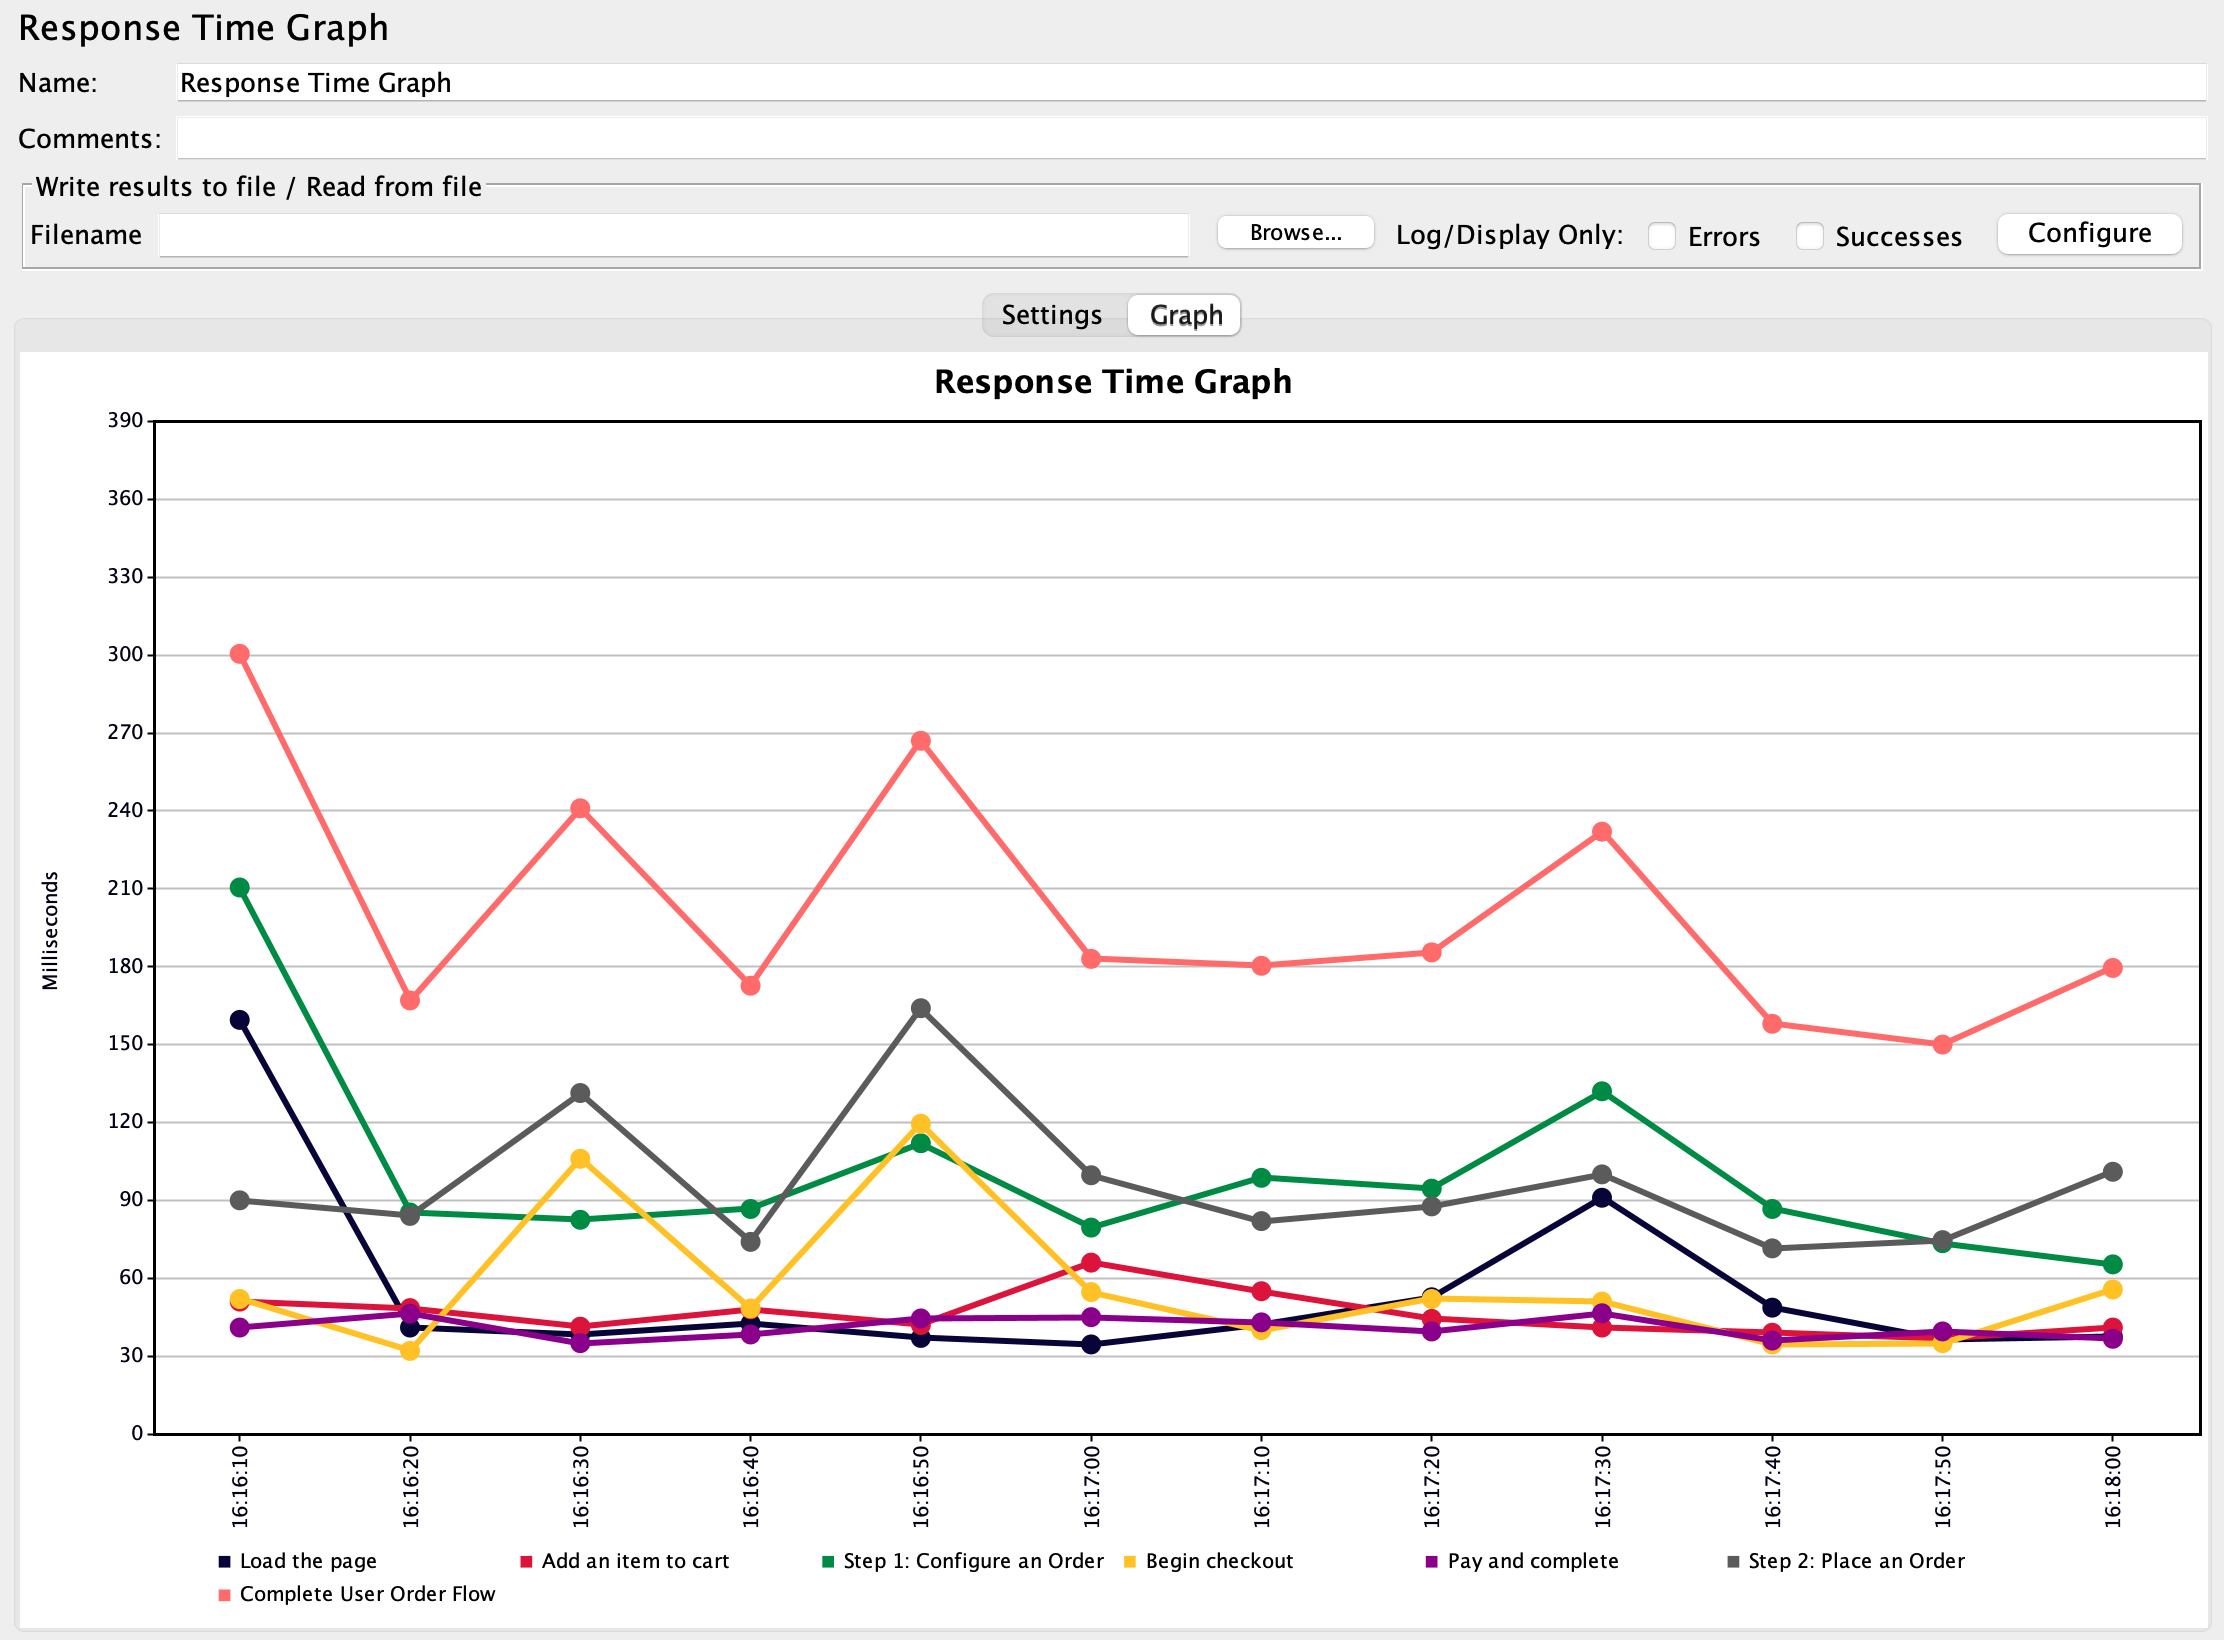
Response Time Graph
The Response Time Graph listener plots the response time of each sampler request against the time of execution, offering a visual representation of how the application's response time varies over time. This graph can be particularly useful for detecting performance issues such as sudden spikes in response times.
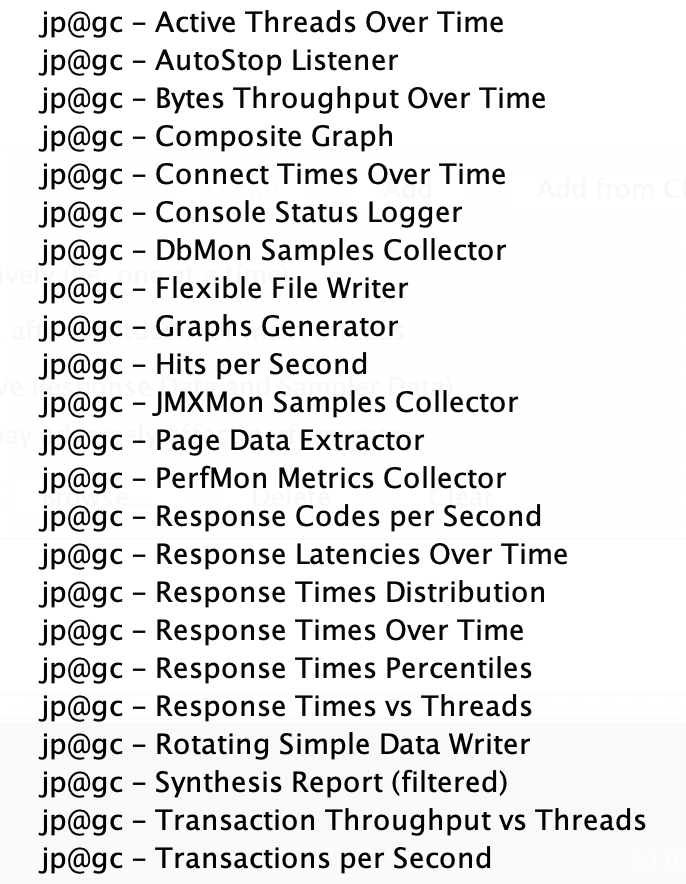
Plugin Reporting Options
JMeter plugins provide a variety of additional charts and reports.
Conclusion
JMeter offers a wide range of reporting options to cater to various user requirements. From basic tabular reports to advanced, interactive visualizations, JMeter enables testers to effectively analyze and present the performance of their web applications. Understanding the different reporting options and their specific use cases can help users make the most of JMeter and optimize their testing efforts.
Testable.io offers a platform for running your JMeter tests and generating a unified report that looks the same across tools (Gatling, Locust, JMeter, etc). You can save any existing JMeter report to your test results as well as customize, share, and export the Testable report.